
Do candlestick really tell you the market direction?
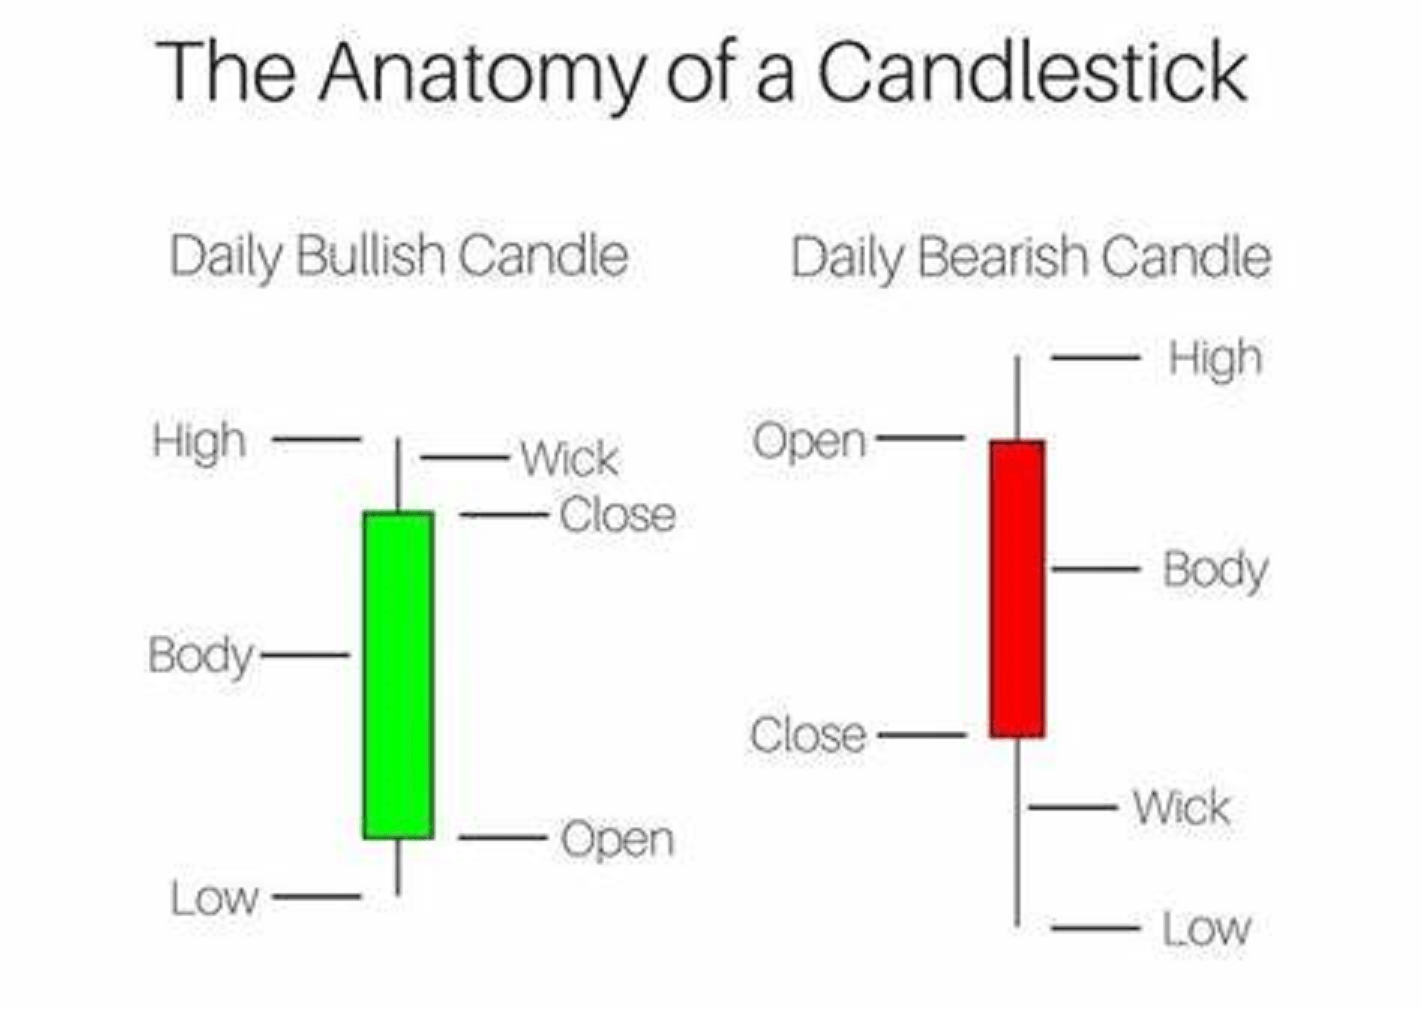
A candlestick is a type of price chart used in technical analysis to represent the price movement of a financial instrument, such as a stock, currency pair, or commodity, over a specific time period. A candlestick consists of a rectangular body and two thin lines, called “wicks” or “shadows,” which extend from the top and … Read more